Follow the Money
August 12, 2018
I was motivated to write this four-part series of columns
on education because I love public schools. Our public education system still
provides an excellent service if you are able to get into a well-functioning
school. My wife and I are both very pleased with the results of sending our
children to San Francisco’s public schools for all their elementary and middle
school years so far.
Nevertheless, too many of our schools are failing too
many of our kids.
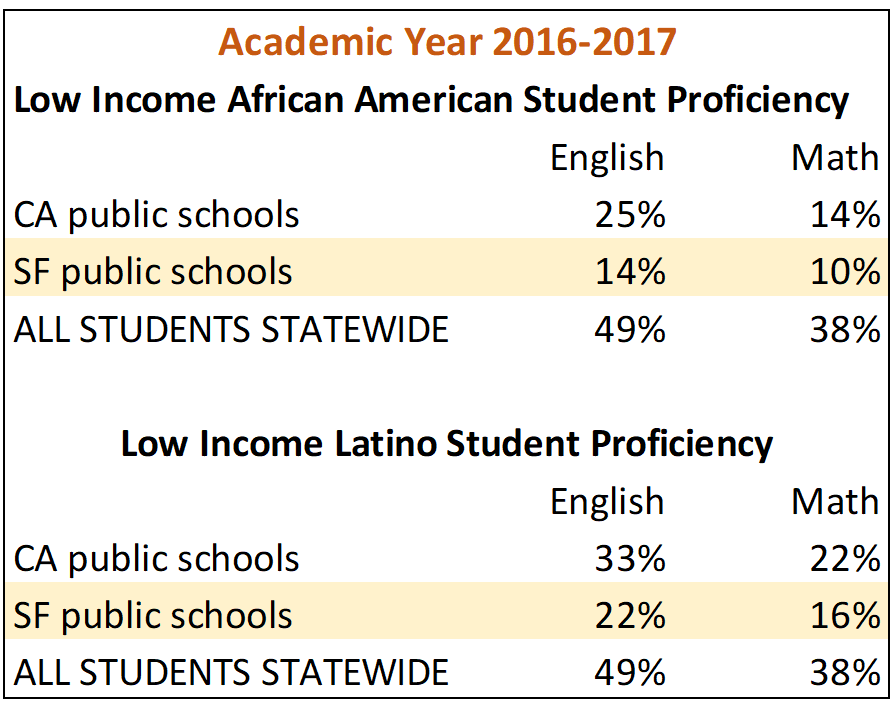
In the first
column, we learned that the primary problem with California’s public
schools is that they compare poorly to those in other states, and in particular
are failing to provide a good education to our neediest kids. We also learned
that San Francisco is doing an especially bad job in this regard (notably in
its eastside schools), calling into doubt how “liberal” or “progressive” we
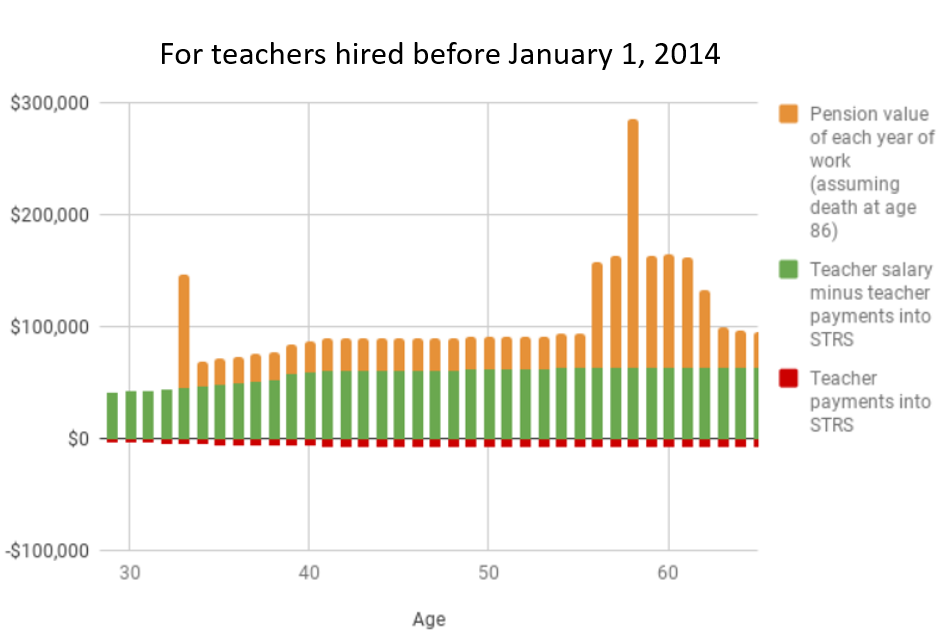
really are as a city when it comes to education. A secondary problem is that
public school teachers (especially the younger ones whose future pension
benefits are highly likely to be less generous than what more senior teachers
have already accrued) are insufficiently compensated for an increasingly
difficult teaching job.
In the second
column, we learned that inadequate funding is one root cause of the
poor state of public education. Proposition 13 de-funded our schools, so that
over the last four decades California has gone from being on par with other
states to being near the bottom of the pack in funding as a percentage of state
income. Over the same time period, our school population has become needier
(e.g. a higher percentage of students do not speak English as their first
language), and so logically should have received more resources, not less. Also
over the same time period, we made substantial pension promises that we failed
to fund; our schools now face a “silent recession” where a greater share of
each future dollar of funding will go to fulfill past promises made – which
means a smaller share of each future dollar of funding will go to teach the
students.
In the third column,
we learned that bad school management is another root cause of the poor state
of public education. California’s Education Code has ballooned six-fold over
the last forty years and is now stifling and bureaucratic. The results are in
from a dozen years of analyzing the experience in New Orleans after Hurricane
Katrina: a combination of radically increased autonomy and accountability can
substantially improve education outcomes in public schools. Autonomy empowers
teachers and administrators on the ground to make the decisions they believe
are best for students in their schools. Accountability ensures that schools
demonstrate their approach is improving outcomes; it also allows low performing
teachers and administrators to be removed when necessary and low performing
schools to be closed when necessary.
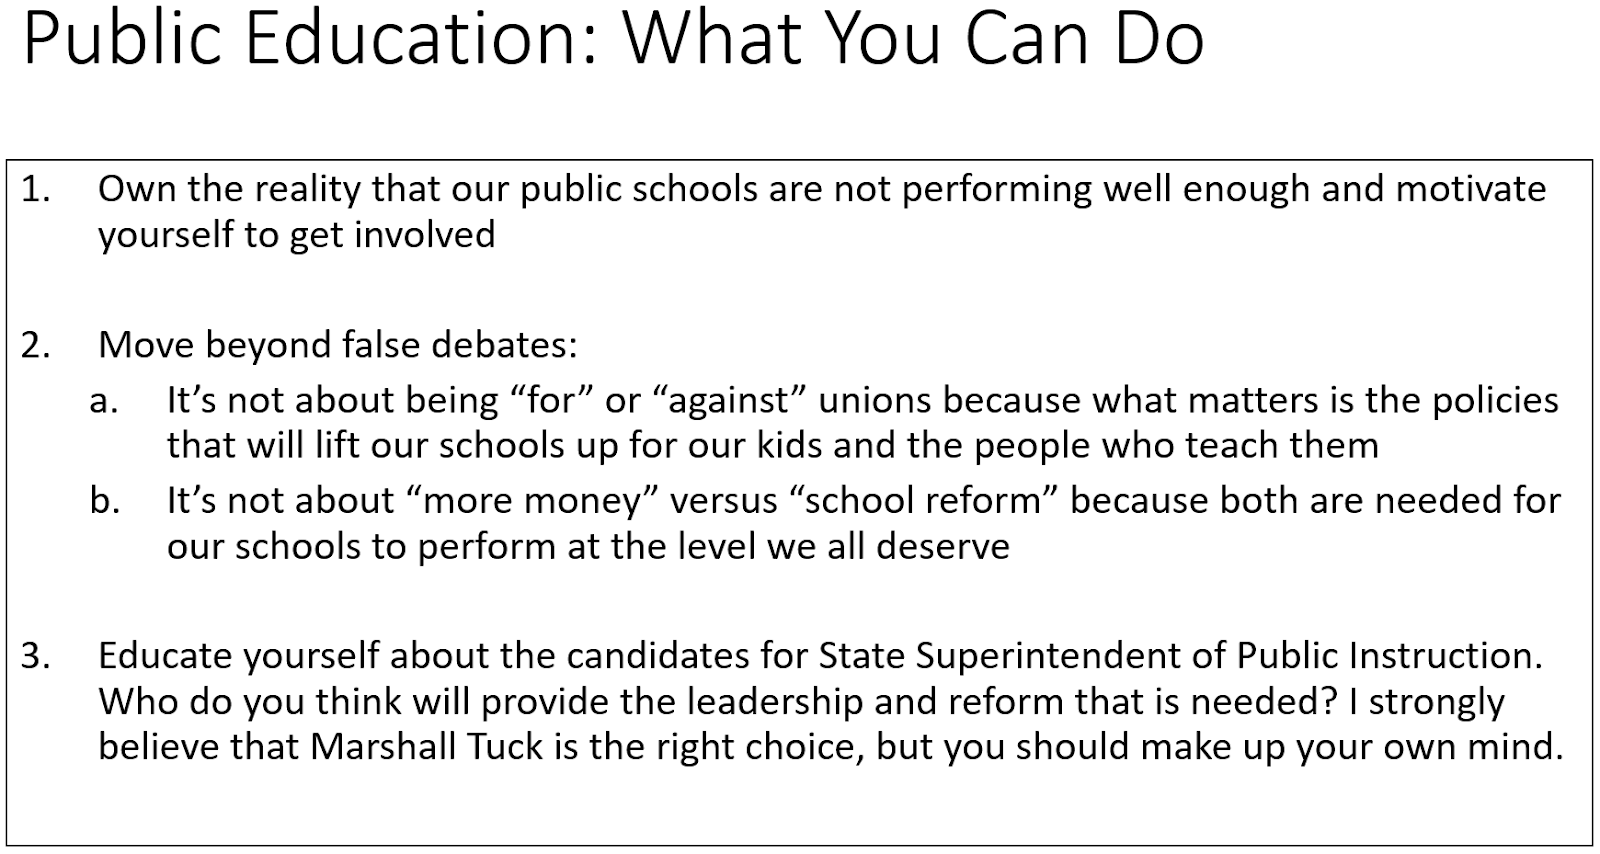
What can each of us do to improve our system of public
education? I suggest three things.
First and foremost, we must own the reality that our
schools are not nearly good enough. California is failing. San Francisco is
failing. The status quo is unacceptable. The fate of our children’s education
is literally our future. A healthy, robust society prioritizes its future by
investing sufficient resources and holding the people responsible for managing
those resources to account. We must acknowledge these truths, internalize their
significance, and motivate ourselves to action.
Second, we must move beyond false debates. For example,
all too often the politics of public education devolves into a debate over
being “for” or “against” teachers’ unions. But Massachusetts is a union state
with one of the highest performing public education systems, while Mississippi
is a right to work state with one of the lowest. There is nothing inherently
good or bad about unions per se; what matters is: first, whether the needs of
students are being met and second, whether the interests of all teachers (and
other school employees) are being reasonably served as long as those teachers
(and other school employees) are doing an adequate job.
Another false debate to jettison is whether “more money”
or “school reform” is needed; in fact we must have both, or neither will
succeed. The Massachusetts Public Reform Act of 1993 is a useful model for us
to study; this grand compromise combined more funding that was progressively distributed
in return for increased autonomy and accountability. California’s recently
enacted Local Control Funding Formula is only a baby step in comparison, but at
least it is a beginning.
Finally, I urge you to educate yourself about the
candidates running for office and ask yourself who is likely to fight for the
smart, radical changes we need. One race in particular to focus on this year is
the State Superintendent of Public Instruction. This is not a race most people
are not even aware of, let alone focused on, yet it matters a lot. Some of the
things the State Superintendent can do is:
1.
Interpret the Local Control Funding Formula to
allow poorer schools within districts to receive greater funding over time –
and intervene aggressively with failing schools
2.
Work with districts to get multi-year “master
waivers” from unnecessary regulation to empower them to innovate
3.
Build a data system to capture and share best
teaching and administrative practices across the state (and create a governance
structure to support its use and implementation)
4.
Use the public megaphone to advocate with the
governor and legislators for the funding and reform our public schools need
The two candidates running this fall for State
Superintendent of Public Instruction are Marshall Tuck and Tony Thurmond. When I published the original version of this column in the Examiner, I was asked not to formally endorse either candidate. But here, I can tell you that I wholeheartedly endorse Marshall Tuck. I have met several times
with Marshall Tuck and he has greatly impressed me with his knowledge, his
passion, and his ideas. And Marshall Tuck has the full-throated endorsement of
Arne Duncan, who was US Education Secretary under President Obama.
I encourage you to learn about both Marshall Tuck and
Tony Thurmond, so you can make up your own mind. But whatever you do, don’t sit
this race out! Your engagement in November and beyond is critical for the
future of our public schools.